Defining Psycho-social Well-being
There are various models of psychosocial/psychological well-being in the literature, some derived from adulthood and others from studies on children (Cowen, 2000; Lerner & Castellino, 2002; Masten & Coatsworth, 1998; Pittman, Irby & Ferber, 2000; Roth & Brooks-Gunn, 2002; Ryff, 1995; Moore et al., 2001).
In this study, psychosocial well-being reflects the close connection between psychological aspects of individual experience and the wider social experience that is expressed through an individual’s positive cognitive, emotional and behavioral functioning (Sameroff, 2000).
There are three primary frameworks of positive functioning that I build from in selecting my key indicators of adolescent psychosocial well-being i.e.,
- the psychological well-being framework proposed by Ryff (Ryff, 1995, 1989) and Moore (Moore et al., 2001),
- the positive youth development framework proposed by Pittman (Pittman et al., 2000) and Catalano (Catalano, Berglund, Ryan, Lonczak, & Hawkins, 2002), and
- the developmental assets framework proposed by Search Institute (Benson, 2002)
So how did we ensure that the markers of PWB (i.e. PS, PO, and PC) were distinct? Or, how did we ensure the scales were distinct? We used EFA and CFA (see below).
Through split-half cross-validation, the derivation group with 936 respondents was used for exploratory purposes (EFA), and the validation group with 882 respondents was used to confirm the structure of PWB found (CFA).
Through split-half cross-validation, the derivation group with 936 respondents was used for exploratory purposes (EFA), and the validation group with 882 respondents was used to confirm the structure of PWB found (CFA).
Exploratory Factor Analysis
Using SPSS, both varimax and promax rotations were utilized. Given that similar results were obtained using maximum likelihood, generalized least squares, and principal axis factoring, and that I expected factors of well-being to correlate, results from the maximum likelihood method with a promax rotation are presented in the results section.
Items were dropped if they significantly contributed to loading patterns that were far from the hypothesized structure. Six items were dropped as they had loadings less than .3 and issues of cross-loading across factors; three of which upon further inspection had a weak Malay translation given a lack of local words identical in meaning.
Final structure is provided below.
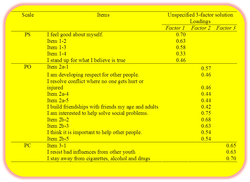
The final unspecified three-factor solution in EFA provided clear support for three distinct factors, i.e., PS, PO, and PC, with 19 items loading at 0.3 or higher onto each factor (see Table 1)[1]. In fact, this 3-factors solution was far superior to a 4-factor solution that was initially tested in EFA (not described here).
[1] Given that the three factors correlated above .4, a decision was made to rely on the final structure obtained through oblique rotation (i.e., Promax).
[1] Given that the three factors correlated above .4, a decision was made to rely on the final structure obtained through oblique rotation (i.e., Promax).
Confirmatory Factor Analysis
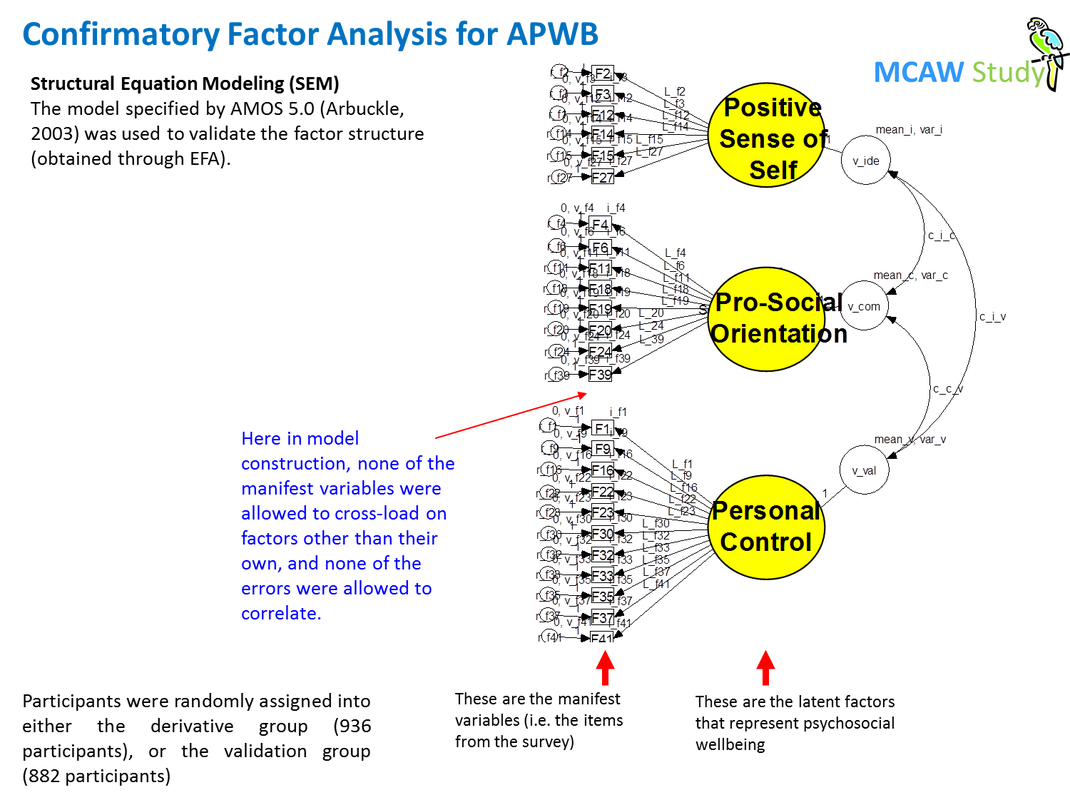
Structural Equation Modeling (SEM) specified by AMOS 5.0 (Arbuckle, 2003) was used to validate the factor structure obtained through EFA above. SEM procedures are described elsewhere (Bollen & Lennox, 1991; Muthen, 1994). None of the observed items were allowed to cross-load on other factors, and none of the errors were correlated. Model fit was determined by observing fit indices.
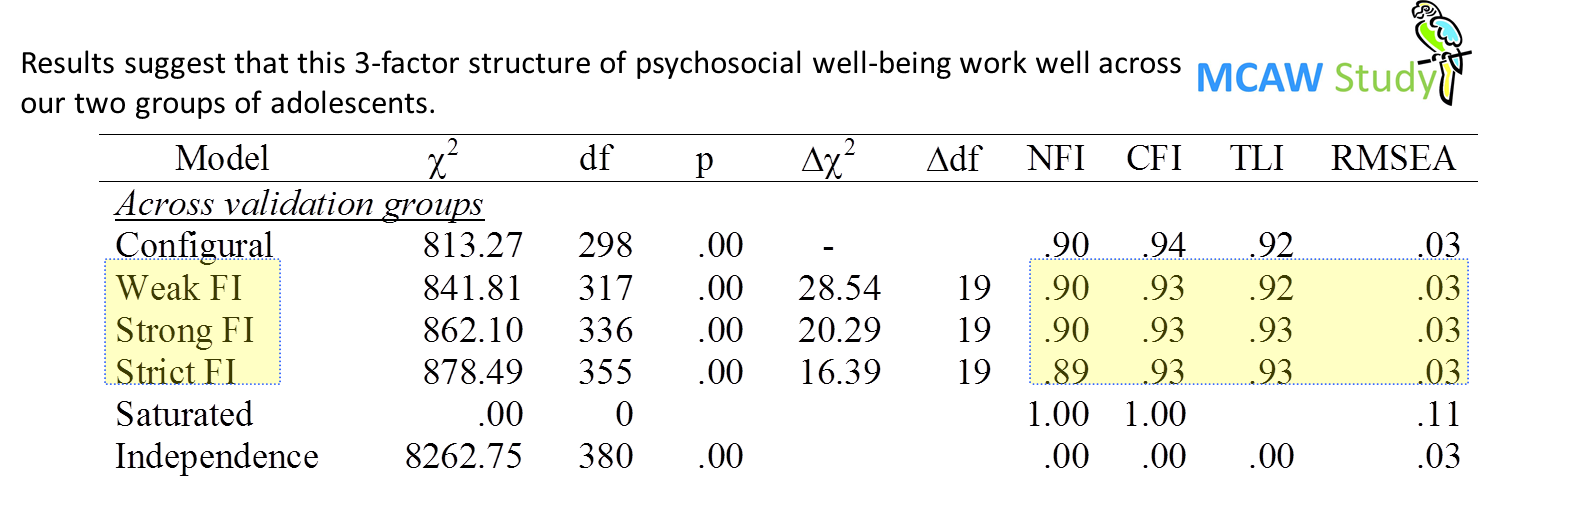
Evidence for measurement invariance across the two samples involved a nested sequence of increasingly stringent tests for factorial invariance, i.e.
How well the factor structure worked across both samples (i.e., model fit) was determined by observing fit indices that included the NFI, CFI, TLI, RMSEA and the c2
(Normed Fit Index; Bentler & Bonnett, 1980; Comparative Fit Index; Bentler, 1990; Tucker-Lewis Index; Tucker & Lewis, 1973; Root Mean Squared Error of Approximation; Steiger, 1990).
The results were compared to a baseline independence model (where factor loadings, factor invariance and factor covariances were set to 0).
- weak (where factor loadings were made equal across both groups… e.g. L_f2a = L_f2b)
- strong (where factor loadings and mean intercepts were made equal), and
- strict (where factor loadings, mean intercepts, and unique variances were made equal)
How well the factor structure worked across both samples (i.e., model fit) was determined by observing fit indices that included the NFI, CFI, TLI, RMSEA and the c2
(Normed Fit Index; Bentler & Bonnett, 1980; Comparative Fit Index; Bentler, 1990; Tucker-Lewis Index; Tucker & Lewis, 1973; Root Mean Squared Error of Approximation; Steiger, 1990).
The results were compared to a baseline independence model (where factor loadings, factor invariance and factor covariances were set to 0).

|
In this test, chi-square indicates a significant difference between the model. But given that all other fit indices are good, we can ignore chi-square as the difference is caused by the large sample size used.
|
That these items, derived from American measures, were able to fit a conceptual and measurable model in Malaysia is encouraging. Further, that this 3-factor psychosocial well-being model provides satisfactory fit for both boys and girls (not shown above), permits the use of the same measures for future work on gender comparisons.
Discussion
Until more recently, most research equated well-being with the absence of disorder or disease (Moore & Keyes, 2003). Rather than using indicators of a lack of well-being to measure well-being, this study explored the use of positive indicators that reflect positive psychosocial functioning. Being able to measure these key areas may provide us with indicators of how well societies are nurturing their young for present and future functioning in their social environment. These indicators may also provide us with outcome markers that we can target in programs aimed at promoting healthy youth development (Zaff, Smith, Rogers, Halle & Bornstein, 2003).
